
August Markets: The Themes Shaping What’s Next

By Todd Vandam, CFA

Equity markets were positive for the month with the S&P 500 up 2.6% and the MSCI EAFE index (international equities) up 1.8%. The Nasdaq Composite and the MSCI Emerging market index were strong performers, up 3.9% and 3.2%. This brings year-to-date performance for the S&P 500 up 12.3%, the MSCI EAFE up 11.8%, the Nasdaq Composite up 13.5% and the MSCI Emerging Markets index up 22.4%

The US government bond market yields were mixed across the yield curve. The US Treasury 2-year bond yield was up 6 basis points to 4.34%, the US Treasury 10-year bond yield was unchanged at 4.75%, and the US Treasury 30-year bond yield was down 2 basis points to 5.25%. Notable topics for the bond market were the US Treasury doubling the size of the long bond buybacks which stabilized the rise in long term bond yields and a “hawkish”, inflation focused, speech at Jackson Hole Economic Symposium by Fed Chairman Warsh which increased the probability of near-term Fed rate hikes.

Within S&P 500, Energy was again the leading sector, up 6.5%, followed by a rebound in Technology, up 6.2%, and Materials up 5.8%. Sector underperformers for the month were Utilities -5.2%, Industrials -2.7%, and Real Estate -2.0%.

The US Dollar index fell 0.5% to 99.43 while WTI oil and Brent Crude oil continued to rise, up 1.3% and 0.4% to $85.76 and $90.49 respectively amidst the lack of a clear resolution between the US and Iran for the full reopening of the Strait of Hormuz.

Global Market Summary

Global stocks, U.S. sectors and interest rates

Global Stock Market Summary
Index Level WTD MTD QTD YTD
S&P 500 7686 -0.3% 2.6% 2.5% 12.3%
Dow Jones Industrials Average 53185 -0.7% 1.3% 1.7% 10.7%
NASDAQ Composite 26370 -0.1% 3.9% 0.6% 13.5%
MSCI Emerging Markets Index 1719 -0.2% 3.2% -0.2% 22.4%
MSCI EAFE Index 3233 -0.4% 1.8% 3.7% 11.8%
MSCI All Country World Index 1149 -0.3% 2.6% 2.6% 13.3%
MSCI Europe Index 2877 -0.7% 1.2% 2.8% 8.9%

Sector Performance
Index WTD MTD QTD YTD
Energy 2.1% 6.5% 19.8% 41.4%
Technology 0.3% 6.2% 2.5% 22.4%
Cons. Stap. -0.3% -0.8% 1.1% 7.9%
S&P 500 -0.3% 2.6% 2.5% 12.3%
Healthcare -0.4% 4.8% 7.1% 9.9%
Financials -0.7% 1.2% 7.3% 5.1%
Cons. Disc. -0.7% -0.1% 0.7% -0.4%
Real Estate -0.8% -2.0% 0.4% 10.1%
Materials -0.8% 5.8% 4.0% 15.5%
Industrials -1.2% -2.7% -5.7% 12.7%
Utilities -1.2% -5.2% -7.3% -1.6%
Comm. -1.6% -1.2% -0.8% -0.3%

Global Rates Summary
Aug 31, 2026 Jul 31, 2026 Jun 30, 2026 Dec 31, 2025
3-Month Treasury Yield 3.91% 3.83% 3.87% 3.67%
2-Year Treasury Yield 4.34% 4.28% 4.14% 3.47%
10-Year Treasury Yield 4.75% 4.75% 4.44% 4.18%
30-Year Treasury Yield 5.25% 5.27% 4.91% 4.84%
30-Year Fixed Mortgage 6.66% 6.66% 6.49% 6.15%
German 10-Year Bund Yield 3.32% 3.21% 2.86% 2.85%

Currencies and Commodities
Index Level MTD QTD YTD
US Dollar Index 99.43 -0.5% -1.7% 1.1%
Euro 1.16 1.0% 1.6% -1.1%
Chinese RMB 6.72 0.4% 1.0% 3.8%
Japanese Yen 159.69 -0.3% 1.7% -1.9%
British Pound 1.36 0.7% 2.2% 0.8%
WTI Oil 85.76 1.3% 23.4% 49.4%
Brent Oil 90.49 0.4% 24.1% 48.7%

What we are watching:

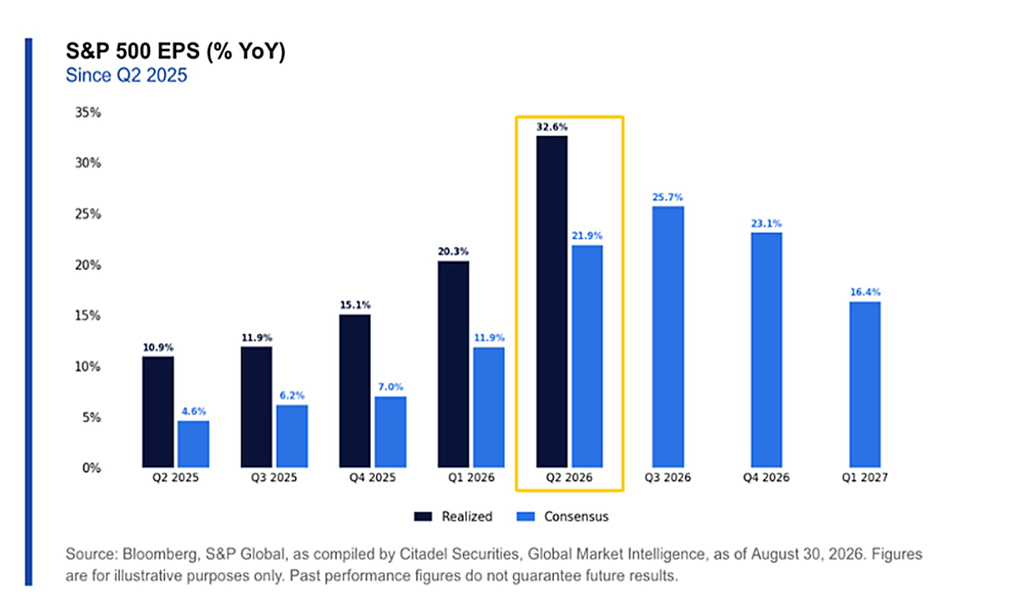
1) Strong Earnings: Earnings were +32% for Q2 vs +21% expected with 20% “plus” expected earnings growth over the next two quarters and above average +13-15% earnings growth for 2027. Continued above average earnings growth expectations have brought forward S&P 500 P/E valuations more in line with five-year averages and should continue to provide support for our equity investments over the next six months.

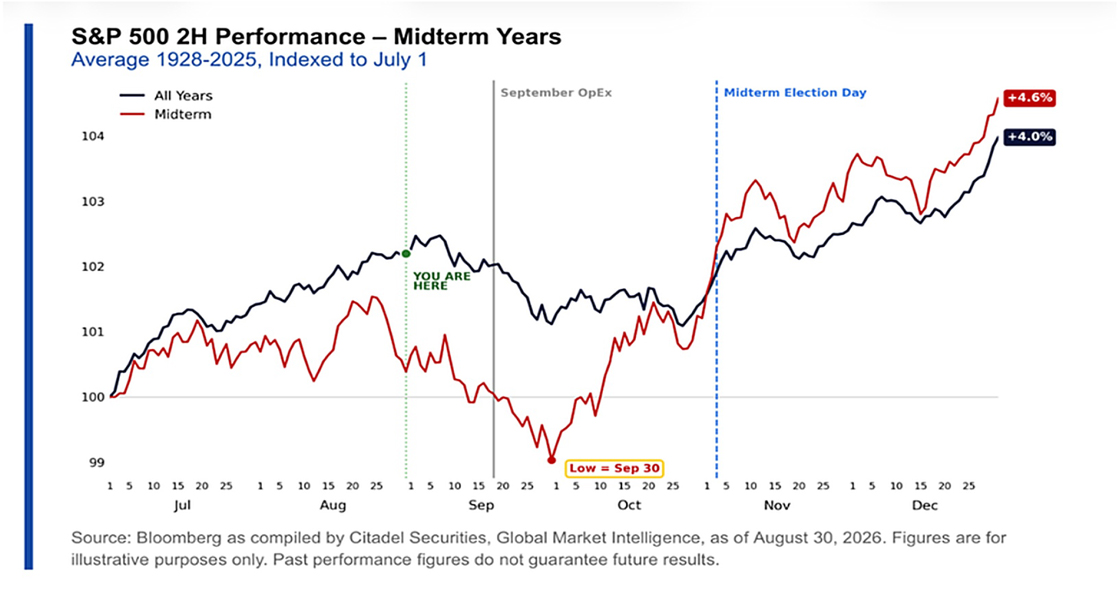
2. September Historic Performance: Since 1928, September has been the only month in which the S&P 500 has finished lower, more often than higher, with an average monthly return of negative 1.1% and an average selloff of negative 4.7%. Selloffs have been more pronounced ahead of midterm elections. While September has traditionally been a weak period for returns, the markets have typically recovered the losses from the pullback and posted positive returns throughout the remainder of the year (see chart below). We feel confident with our below-market risk portfolio positioning going into the month and look forward to taking advantage of any potential selloffs ahead.

The information contained herein is for informational purposes only, is not personalized investment advice, and should not be construed as a recommendation to purchase or sell any particular security, sector, or strategy to any individual person or entity. Past performance should not be considered as an indicator of future results.

Forecasts of financial market trends that are based on current market conditions constitute Pallas Capital Advisors, LLC’s judgment, and are subject to change without notice. “Expected” return estimates are subject to uncertainty and error. The ability to achieve similar outcomes is subject to risk factors over which Pallas may have no or limited control. References to expected returns are not promises or even estimates of actual returns an investor may achieve.

Alternative asset classes, such as private equity and private credit can offer diversification and greater return potential to an investment portfolio, but they also carry different risks, including illiquidity, valuation complexities, and lower regulatory oversight compared to public investments. Investors should carefully consider their investment objectives, risk tolerance, and the illiquid nature of these assets before investing.

Investment Advice offered through Pallas Capital Advisors, LLC, a registered investment advisor. CRN26_41